08 Sep 2018
Impact: Positive (Farm Incomes); Positive (Consumption); Negative (Inflation)
Brief: Effective implementation of the much higher support prices (MSP) remains questionable and leads to wasteful compensatory Government expenditure. We propose a nationwide strengthening of the e-NAM system through the appointment of third party assayers. Under the system, cultivators may take third party assessment certification from licensed assayers and trade their produce online. Buyers on the other hand can offer a price based on the certification – obviating the need of physical inspection.
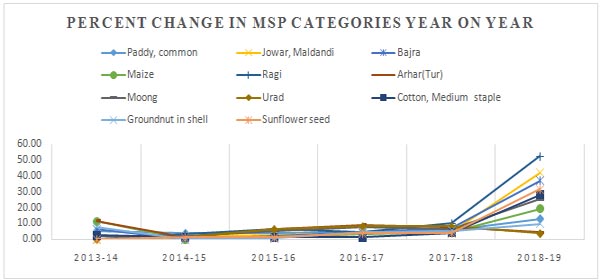
We believe that the greater risk of higher MSP will be on consumer items instead of headline inflation. This is because it is statistically proven that category wise rise in MSP reduces that category's inflation significantly; the over 30% decline in Pulse price between 2015-16 and 2017-18 is a case in point. Our estimate of incremental non-food combined CPI because of the MSP is 70 bps, which will be mostly spread out between Q4 FY19 and early FY20.
On the contrary, since India is a domestic demand driven economy, encouraging consumption is the key to macro stability. A commiserate rise in Minimum Support Price (MSP) will aid higher income and hence higher consumption of the farm sector population translating into revival of capital expenditure and rise in capacity utilizations levels. Effective implementation of the much higher support prices however remains questionable.
We believe that this can be alleviated by taking advantage of the current Government's digitization initiatives. e-NAM or electronic national agriculture market is one such initiative that can bring about significant efficiencies in the system and act as a double edged sword to fight inflation and reducing public burden simultaneously. This way, the two primary concerns that are potential spillovers of a consumption multiplier, can be addressed.
According to our estimate, share of e-NAM in India's total food grain production (including Oil seeds) is only 5.8% on average, since inception in April 2016. This is surprisingly low, given the Government impetus on Jan-Dhan, Aadhar and Mobile (JAM) based retailing given the renewed focus on Direct Benefit Transfers (DBT). The situation has not only created demand-supply mismatches for the cultivators (and related businesses) but also led to divergent inflationary trends across India. Despite the Government's unprecedented support in keeping the prices relevant through market interventions, none of the above concern have been meaningfully resolved.
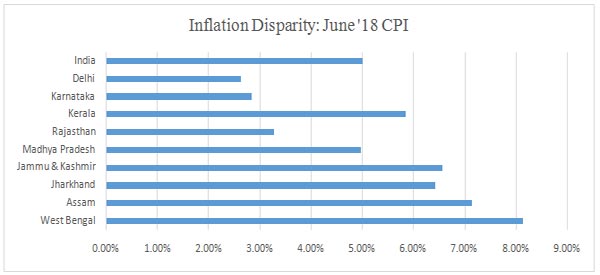
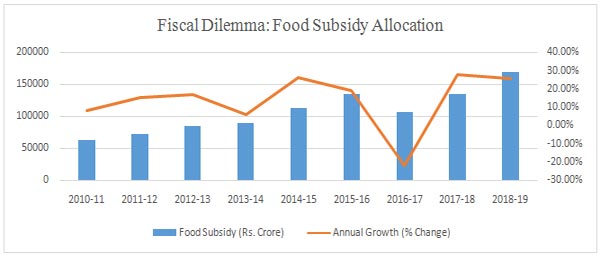
The scenario pertaining to diverse inflation realities across the country is a case in point here. Comparing combined inflation among India's 23 states and union territories reveals that the June FY19 CPI ranges between 2.63% (Delhi) and 8.15% (West Bengal). This despite Government of India's 27% increase in Food Subsidy allocation for FY19; a substantial amount given the previous year's boost of 21%. On the supply side, higher MSPs did not help cultivators uniformly either, with farm loan waivers compensating for lower realizable prices.
As a solution, we propose a nationwide strengthening of the e-NAM system through the appointment of third party assayers. We understand that the primary reason for the failure of the digitized platform is the lack of trust on agro commodities being traded. Since there is no standardized methodology for independent assessment across APMCs, a licensed assayer system can be implemented.
Under the system, cultivators may take third party assessment certification from licensed assayers and trade their produce online. Buyers on the other hand can offer a price based on the certification – obviating the need of physical inspection. The trusted online interaction between buyers and sellers will optimize demand-supply equilibrium and free Government machinery of wasteful monetary interventions. With uniformity, we see a normalization of agro based commodity prices taking place across states – thereby controlling inflation and deficit financing.
e-NAM's share miniscule in total Food Grain production
| Year | Total Food Grain Production (+Oil Seeds) Tons | Share of e-NAM* |
| 2015-16 | 14,17,90,000 | 0.00% |
| 2016-17 | 15,98,53,600 | 5.82% |
| 2017-18 | 15,94,10,000 | 5.84% |
Source: Ministry of Agriculture; Acuité Knowledge Center; *Acuité estimate
Kharif Seasonal Food Grain Production (1000 Tones)
| Year | Food grain | Cereals | Pulses | Oil seeds | Sugar |
| 2011-12 | 131232 | 125174 | 6058 | 20,691 | 361,037 |
| 2012-13 | 128071 | 122155 | 5916 | 20,791 | 341,200 |
| 2013-14 | 128695 | 122697 | 5998 | 22,624 | 352,142 |
| 2014-15 | 128069 | 122336 | 5733 | 19,221 | 362,333 |
| 2015-16 | 125092 | 119562 | 5530 | 16,698 | 348,448 |
| 2016-17 | 138328 | 128743 | 9585 | 21,526 | 306,069 |
| 2017-18 | 138730 | 129730 | 9010 | 20,680 | 355,100 |
| 2018-19* | 136803 | 127729 | 9079 | 19,677 | 333,509 |
Source: Ministry of Agriculture; Acuité Knowledge Center; *Acuité Estimate

Source: MOSPI

Source: Ministry of Agriculture; Acuité Knowledge Center

Source: Ministry of Finance; CGA; Acuité Knowledge Center; FY19 Figures are BE

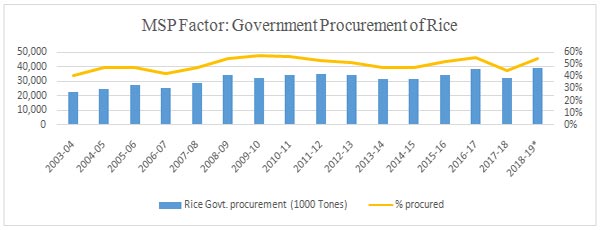
Source: Ministry of Finance; CGA; Acuité Knowledge Center; *Acuité Forecast