 +91 99698 98000

NEW BACK SERIES REVEALS THAT INDIA GREW SLOWER THAN PREVIOUSLY ACCEPTED
30 Nov 2018
Commentary: New back series reveals that India grew slower than previously accepted; The GDP may lose over Rs. 2.5 lac crore in value as a result of this revision
The new GDP backward series has been released by the CSO with a revised base year of 2011-12. The biggest surprise that the series presents is the fact that India grew on average 130 bps less than previously anticipated over a 7-year period (between FY2006-2012).
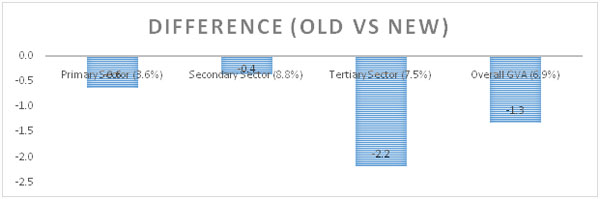
While looking at the segmented growth, it is noted that the Primary Sector (Agriculture), grew by 3.6% as compared to 4.2% recorded previously. Secondary Sector (Industry) on the other hand grew by 8.8% as compared to 9.1% on average, as per the old series. Tertiary Sector (Services), which is often termed as the backbone of the Indian economy, recorded the greatest deflation, by growing at just 7.5% as compared to 9.7% earlier. Therefore, each sector under consideration has lost (-) 0.6%, (-) 0.4%, (-) 2.2% over the seven years' period, respectively.
Overall, the Gross Value Added (GVA), as a result has lost almost (-) 1.3% or 130 bps in the timeframe. We estimate that this value deflates the Indian GDP by almost 2.5 lakh crore, in present money. This roughly costs an Indian, an average per capita loss of around $28. However, despite these differences in the GDP series, we believe that India will be able to cross the threshold of $2100 by the end of this calendar year.
The CSO reasons that these differences are a result of using newer and updated information. For example, the valuation of the primary sector is impacted by the lower base effect emanating from using FY12 data and the difference in theWPI deflator. In case of secondary sector, the difference has been connected with using the data from the updated Annual Survey of Industries 2011-12 as compared to that of 2004-05, used in the earlier series. Meanwhile, services have seen their growth declining due to the usage of National Sample Survey (NSS) 67th Round as compared to NSS 55th Round data utilized previously. CSO has also abstained from using Gross Trade Income (GTI) Index in valuing services as it does not seem to represent the ground realities pertaining to the newer tax regime.
The other significant difference as represented by the series is the revised GDP weights (current prices) for each sector. While the Primary sector has gained nearly 1.5 percentage points as per the revised series, the tertiary sector has lost almost 5 percentage points. Secondary sector is the biggest gainer here as its share represented almost 30% of the Indian GDP by FY12 – gaining almost 5% over the seven-year period. This momentum however abated post the FY12 threshold.
GDP Back Series (FY2006-2012) with Base Year FY12
Source: MOSPI; Acuité Research