+91 99698 98000

RUPEE’S VALUE SHEDDING HAS BEEN THIRD WORST AMONG PEERS
01 Aug 2018
Impact: Negative (Importers); Negative (Combined Inflation); Negative (Current Account Balance)
Brief: Indian Rupee has been relentlessly shedding value over the past three years. With China engaged in active currency devaluation and Turkey being an outlier, India's currency betters only the Brazilian Real
The past one month has brought about some respite for emerging markets (EM) with the ECB postponing its normalization to mid-2019 and the absorption of Japanese issuances by the country's central bank. A somewhat less noisy US Fed also played a role in this new found semblance. However, despite this, the Rupee recovered its lost value slower than most peers.
While volatile South African Rand and Russian Ruble recovered nearly 5% and 2% of their respective values, the INR was stronger by just 0.1% over the past one month. Even the Brazilian Real, which shed almost 19% of its value over the last one year, regained by 3.5% in the time frame. Turkey and China are deemed outliers in this comparison given specific situations at play there. Turkey's massive debt problem and overvalued equity markets (leading to galloping inflation fears) have lost favor with investors; China on the other hand has been deliberately controlling the exchange rates to compensate the volatility emanating from US led trade war.
We believe that the INR has been suffering because of rising imports of now more expensive crude (due to rising domestic demand) along with other critical commodities. Also, Indian equity and debt markets are being clubbed with the larger EM space and therefore exposed to rapid pullout of FPI funds (like peers). These factors have been two primary variables for the value shedding. 2019 being an election year is another possible explanation for foreign portfolio managers and corporates being less faithful towards the INR. Having said that, we believe that the INR's value shedding is more linear as compared to peers and in YTD terms, performance has been relatively better. A parallel argument can therefore be made regarding the INR – as merely finding its correct/real value.
Most depreciating currencies (Depreciation during period):
| Pair | 1 Week | 1 Month | YTD | 1 Year | 3 Year |
| USD/TRY | +0.15% | +6.01% | +29.12% | +38.74% | +76.60% |
| USD/BRL | -0.17% | -3.49% | +17.45% | +18.86% | +3.38% |
| USD/RUB | -1.67% | -1.86% | +8.05% | +3.15% | +0.83% |
| USD/INR | -0.44% | -0.11% | +7.53% | +7.10% | +7.28% |
| USD/ZAR | -1.00% | -4.87% | +6.30% | -0.90% | +3.77% |
| USD/CNY | +0.51% | +2.37% | +4.91% | +1.61% | +9.93% |
# '-' = Appreciation; '+' = Depreciation Against the US Dollar
Current Account Balance (% of GDP)
| Country | 2015 | 2016 | 2017 | 2018* |
| China | 2.71 | 1.80 | 1.37 | 1.18 |
| India | -1.05 | -0.67 | -1.96 | -2.34 |
| Russia | 5.03 | 1.99 | 2.64 | 4.47 |
| South Africa | -4.39 | -3.26 | -2.27 | -2.86 |
| Turkey | -3.74 | -3.84 | -5.55 | -5.40 |
| Brazil | -3.30 | -1.31 | -0.47 | -1.56 |
"*" is IMF projection based on H1 trend
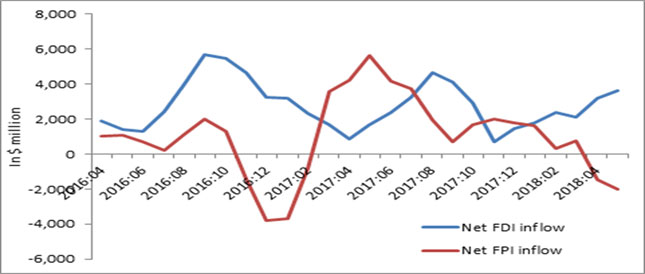
India's FDI and FPI inflows (Simple Moving Average):