+Outlook
- The MPC raises rates by 25 bps, taking Repo to 6.25% and Reverse Repo to 6%
- Strong economic recovery emanating from Government expenditure and healthy monsoon putting pressure on inflation
- GDP expected to expand by 7.3%, with H1 FY19 averaging 7.6%
- Households expect inflation to rise by 130 bps in a 1-year horizon and 90 bps in three months - as revealed by RBI's Survey of Households
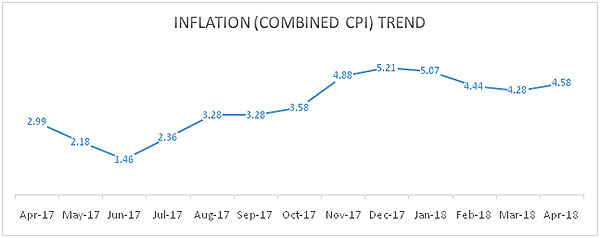
- Both Headline and Core CPI (inflation) is expected to remain beyond the 4% threshold. Headline inflation is expected to remain elevated at 4.7% (average) during the current financial
- Iran crises as well as instabilities in other oil producing nations such as Libya, Venezuela casts a shadow of doubt on stabilizing oil prices. Consistency is expected near the $75-$80 per barrel range in the medium term
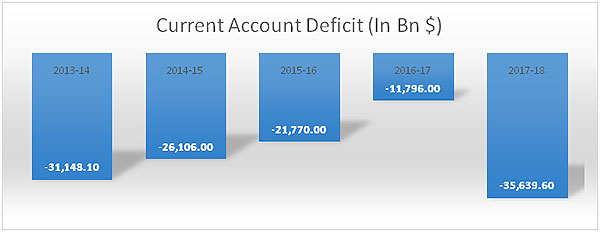
- The elevated oil prices will have significant impact on India's Current Account Balance (CAB) and will exert continued pressure on the Rupee
- The US Federal Reserve's "Dual Mandate” to spur economic growth & job creation as well as controlling inflation at 2% has been putting pressure on bond yields as American interest rates are expected to go up by at least 75 bps this year
- The US rates on 10-year Government Securities (GSecs) are already hovering near the 3% mark and are exerting tremendous pressure on EM debt (sovereign and corporate) including that of India
- Current Forward rate-YTM differential on Indian 10 Year GSec incorporates at least one rate hike. Thinning US- India yield differential is another major concern
+Trend
- Rates have gone up for the first time since H1 2014, when they increased to 8%
- Indian 10 year yields have increased to 8% (as on June 7 2018) from 7.18% (as on November 1st 2017) in a matter of seven months
- Inflation is expected to be in the range of 4.5%-4.7% range in the current financial year. FY18 print was recorded at around 3%
- Crude prices are on a relentless surge and putting pressure on the input costs as well as adding to Current Account Deficit
- Gold imports have declined in the previous two months but Crude has taken away the benefit
- GDP growth is expected to be around 7.3% in FY19. With a strong show in Q4 FY18, the trend is expected to spread in the coming quarters
- Monsoon is expected to be normal this year as well, inducing healthy agricultural growth and farm net incomes (driving rural consumption)
+Impact
- Consumption demand will remain strong and capacity utilization levels expected to be healthy
- This is largely driven by Government expenditure (sourced from revenue expenditure as well as deficit financing) - primarily the mall-effects of HRA benefits and the larger implications of the 7th Pay Commission
- Inflation expectations are also likely to drive up input costs as "output gap” closes as per MPC's assessment
- Banks and other large holders of sovereign and other debt instruments face mark to market risks
- The RBI has however allowed the spreading (1/4th of total) of such risk over a four quarter period, if the losses are over Rs. 100 crore
- Lending rates are also expected to be impacted as factoring in will be insufficient to absorb the shock - given low liquidity in the system
+Rationale
RBI'sMonetary Policy Committee (MPC)raised rates by 25 bps, taking Repo to 6.25% and reverse Repo to 6%. Factors influencing the decision include rising inflation (both headline and core) as well as financial market volatility, which in turn is impacting input costs. We believe that the move is pre-emptive in nature as the MPC was increasingly finding its inflation targets in danger. Interestingly, while raising rates, the MPC has maintained its neutral stance. We assess this to be a containment strategy in order to keep the markets from getting spooked. However, the current trends augur further tightening and we expect an incremental 25 bps rate hike by the end of Q3 FY19. Global volatility and contagion will be an important consideration for the MPC as well as strong US and EU macro performance is creating pressures for the domestic economy.

Source: CMIE

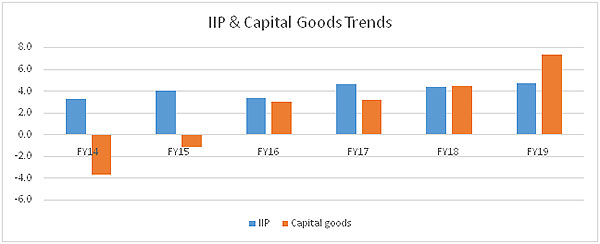
Source: MOSPI, SMERA Knowledge Centre
Note: "*" denotes Acuite estimate

Source: CMIE
| Date | 10 Year US Gsec Yield (%) |
| 2008-01-01 | 3.66 |
| 2009-01-01 | 3.26 |
| 2010-01-01 | 3.22 |
| 2011-01-01 | 2.78 |
| 2012-01-01 | 1.80 |
| 2013-01-01 | 2.35 |
| 2014-01-01 | 2.54 |
| 2015-01-01 | 2.14 |
| 2016-01-01 | 1.84 |
| 2017-01-01 | 2.32 |
| 2018-04-24 | 3.00 |
Source: US Federal Reserve System


