+91 99698 98000

JUL-22 TRADE DATA: DEFICIT POSTS ANOTHER RECORD HIGH
17 Aug 2022
KEY TAKEAWAYS
|
India’s merchandise trade deficit scaled a record monthly high of USD 30.0 bn in Jul-22 vis-à-vis USD 26.2 bn in Jun-22. While both exports and imports declined sequentially, the expansion of trade deficit resulted from a relatively larger contraction of exports (-9.6% MoM) vis-à-vis imports (-0.1% MoM).
Exports
In value terms, merchandise exports moderated to USD 36.3 bn in Jul-22 from USD 40.1 bn in Jun-22. This translated into an annualized growth of 2.1% YoY, the weakest in last 17-months.
- Barring Electronic Goods (that registered a moderate sequential increase of USD 0.1 bn, all other key subcategories either remained unchanged vs. Jun-22 or registered a sequential decline.
- The sequential decline was led by Petroleum Products (USD -2.3 bn), Agri & Allied Products (USD -0.3 bn), Gems & Jewellery (USD -0.3 bn), Chemicals (USD -0.3 bn), Machinery Items (USD -0.2 bn), and Textiles (USD -0.2 bn). The decline in oil exports could be on account of correction in international prices as well as imposition of windfall tax by the government.
- Non-oil exports moderated to USD 29.9 bn, the lowest level in last 8-months.
Clearly, the drop in momentum in exports is driven by the intense global headwinds – continuing geo-political conflict and importantly, the sharp rise in interest rates in the developed economies that induced capital flows out of developing nations and a significant depreciation in their currencies. These factors have translated into lower demand from the importing nations. Further, the government also imposed export duties or restrictions on some commodities to address the domestic inflationary pressures.
Nevertheless, cumulative exports for the first four months of FY23 stand at USD 157.4 bn, an expansion of 20.1% compared to the corresponding period in FY22.
Imports
Merchandise imports remained unchanged at its record monthly high level of USD 66.3 bn in Jul-22, translating into an annualized growth of 43.6% YoY. At a granular level:
- Electronic Items (USD +0.7 bn), Base Metals (USD +0.3 bn), Agri & Allied Products (USD +0.2 bn), and Gems & Jewellery (USD +0.2 bn) were key sub-categories within imports that saw a sequential increase during the month.
- While Chemicals saw a modest sequential increase, it nevertheless touched a record monthly high of USD 6.4 bn in Jul-22.
- Further, at an item wise level, imports of Vegetable Oils, Silver, and Textile Yarn Fabric & Madeup Articles scaled individual monthly peaks in Jul-22.
- Offsetting impact came from sequential decline in case of Ores & Minerals (USD -1.7 bn), Gold (USD -0.4 bn), and Petroleum Products (USD -0.2 bn).
- NONG (Non-oil-non-gold) imports, a key indicator of domestic demand, marginally inched up to USD 42.8 bn in Jul-22 from USD 42.3 bn in Jun-22.
Cumulative imports for the first four months of FY23 stand at USD 256.4 bn, marking an expansion of 48.1% compared to the corresponding period in FY22.
Outlook
The pressure on India’s external metric is a confluence of five factors:
- Complete normalization of retail mobility post the Omicron wave along with high vaccination coverage (with nearly 70% of the population having received double dose) is supporting domestic demand for imports.
- The geopolitical crisis continues unfettered for the sixth consecutive month. The ongoing conflict has started to dampen world trade volume (the IMF in its Jul-22 update of the World Economic Outlook report slashed its projection for growth in 2022 and 2023 world trade volume (goods and services) by 90 bps and 120 bps to 4.1% and 3.2% respectively. This has started to manifest via moderation in India’s exports.
- In the very near term, a marginal adverse impact on exports is also on account of the recently imposed export duties or restrictions by the government in case of select commodities. However, this could get reversed in the coming months.
- While most international commodity prices eased considerably in Jul-22 on concerns over global slowdown, the impact is yet to get manifested in India’s trade numbers completely.
- Individual cases of persistence of supply disruption (in case of like import of Vegetable Oils, Coal, etc.) and sudden spurt in demand (in case of import of Silver on account of substitution effect vis-à-vis gold and its rising demand on for green infrastructure) is also seen to be playing a role.
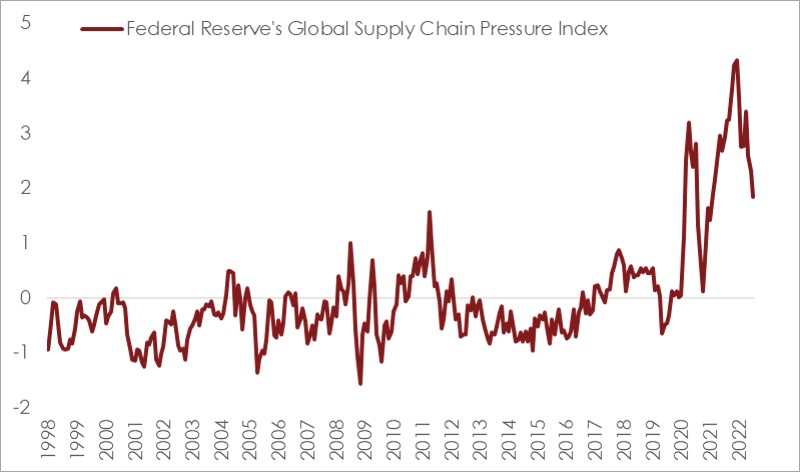
While the monthly trade deficit prints could moderate in the coming months as impact of somewhat lower commodity prices trickle down and global supply chain pressures ease, increasing risks to exports and relatively robust demand for imports is now likely to provide an upside risk to our FY23 current account deficit projection of USD 105 bn.
Table 1: Highlights of merchandise trade balance

Note: Numbers may not add up due to rounding off and revision in headline exports and imports
Chart 1: While elevated, global supply chain pressures are seen to be easing