+91 99698 98000

JAN-21 IIP: GROWING WEARY?
15 Mar 2021
KEY TAKEAWAYS
|
Industrial production disappointed in Jan-21 as it contracted by 1.6%YoY compared to an expansion of an equal magnitude in the previous month. The deterioration belied market expectations of an improvement (+1.0%) built on revival seen in several lead indicators
The Internals: Dismal on all counts
- On the sectoral side, while mining growth remained in contraction for the fourth consecutive month, manufacturing growth slipped into a contraction yet again (-2.0%YoY) pulling down the overall headline growth. Electricity growth, capped the downside, at 5.5%YoY in its fifth consecutive month of expansion.
- On the use-based side, the picture was a bit diverse. The contraction was primarily driven by Capital (-9.6%YoY) and Consumer Non-durable goods (-6.8%), along with consumer durables at the margin. Weakness in consumer goods possibly reflects a dilution of pent-up and festive demand seen in Q3 FY21. The other sub-sectors of Primary, Intermediate and Infrastructure & construction goods posted a meagre positive growth (of <1%) in the month (see table below).
- At a granular level, of the 23 manufacturing industries, only 5 grew on an annualized basis in Jan-21 underscoring the broad-based nature of the weakness (namely Chemicals, Basic Metals, Wood, Rubber & Plastic and Other Transport Equipment).
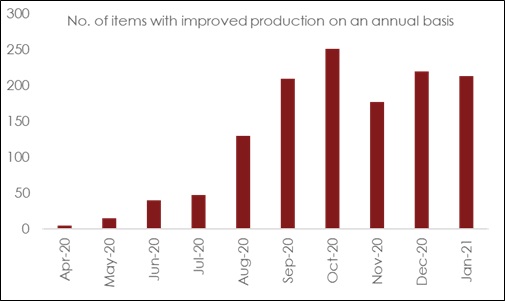
- On an item-level basis, of the 403 items covered in IIP basket, 213 exceeded their output volume in Jan-21 on an annualized basis, which was not very different from 220 items in Dec-20. Tacitly, this implies that while the breath of recovery did not deteriorate drastically, the scale of contraction definitely outweighed.
Outlook
Jan-21 IIP data is yet another reminder of the tenuous and still nascent economic recovery. Nevertheless, contraction is somewhat surprising given the recovery seen in lead indicators such as auto sales, GST collections, PMI manufacturing, non-oil exports among others. As such, we would tag Jan-21 data more as an aberration, and given IIP’s inherently volatile nature, refrain from extrapolating it as a weakness in economic revival as yet.
Looking ahead, we expect growth recovery to continue to improve, on trend, owing to -
- Despite localized spike in COVID cases in select states, mobility indicators continue to improve and are now <10% below pre-COVID levels
- Sustained progress on rollout of vaccine in India, with 2.0% of the population getting inoculated so far is a boost to consumer and business confidence, as also validated by survey-based indicators such as PMI and RBI’s Industrial Outlook Survey.
- The policy environment, characterized by a countercyclical fiscal outturn reinforced in the Union Budget FY22 amidst an accommodative monetary and liquidity backdrop that RBI remains committed to, will continue to remain in support of an economic recovery.
We expect GDP to post a V-shaped recovery, with FY22 growth at a record high of 11.0%. This anticipated recovery would be front loaded as H1 FY22 would benefit from a significantly favorable base effect.
Annexure-1
Chart 1: IIP Growth: Components
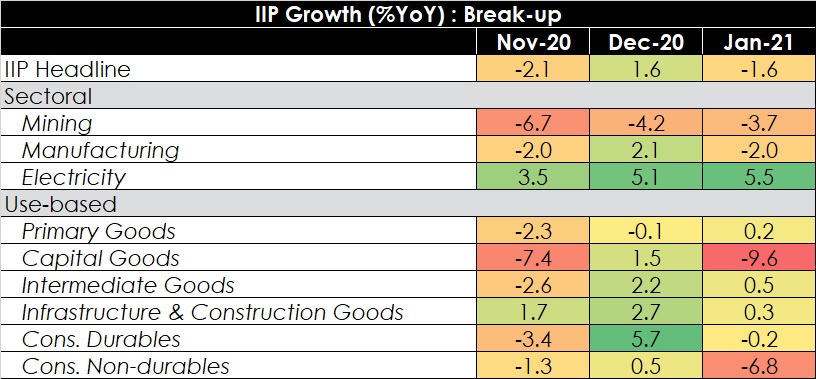
Chart 2: Number of items in IIP that saw improvement in production on an YoY basis