13 Nov 2019
As India records one of the slowest expansion rates in its recent economic history, global institutions have been forced to reconsider the India story. Recently, Moody’s has changed India’s outlook to negative from stable over concerns regarding slowing economic growth, rising public debt along with chances of fiscal indiscipline. We note that even though most of these factors are debilitating for every country on earth, India’s population size continues to penalize its outlook.
From the vantage point of a domestic credit rating agency, Acuité assesses India’s sovereign rating stability through the lens of peer comparison and basket level performances. In order to achieve this objective, we have compared India with its BBB rated peers in aforementioned parameters. For consistency in our assessment, we have also considered a few other high frequency macro variables that are often ignored in rating a sovereign. Data time series ranges between CY2016 and CY2019, given the fact that India received its rating upgrade in CY2017.
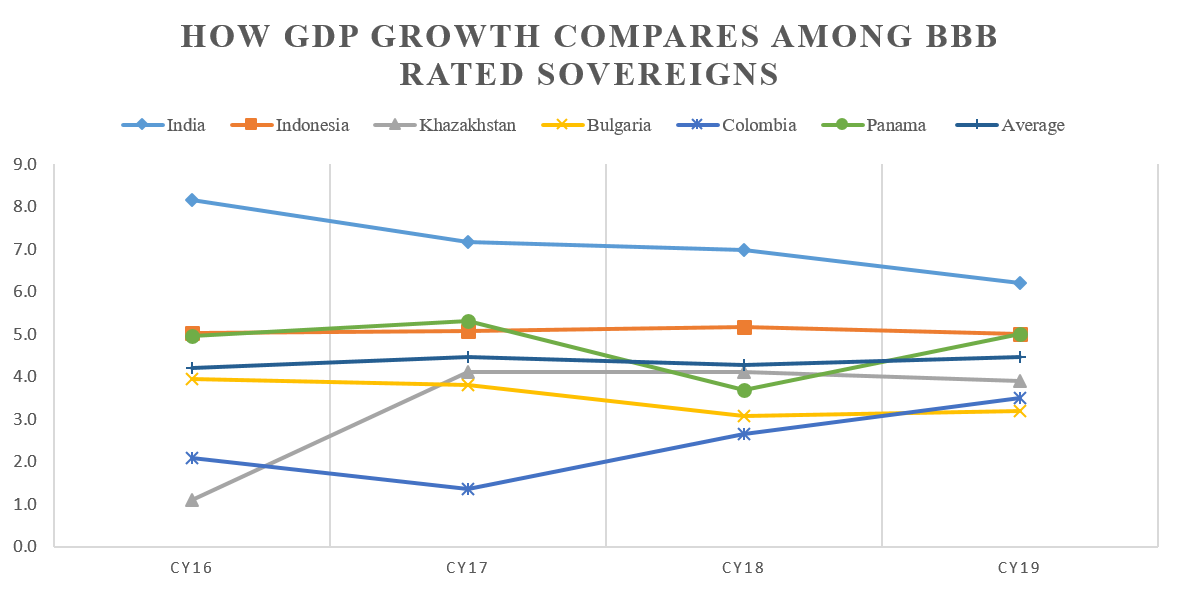
GDP/ Economic Growth: Overall, the BBB Basket has averaged a growth of 4.4%in CY19, almost similar to the average achieved in CY16
Perhaps the most important parameter used by agencies to evaluate an emerging economy such as India is the rate of economic expansion or simply put, GDP growth. As apparent from the chart below, while it is clear that India has been the fastest expanding sovereign in its peer group, the fall in growth in CY19 has adversely impacted its outlook. From the highs of over 8% in CY16, the rate of growth has come down to a little over 6% in CY19 – a substantial drop of nearly 200 bps. When looking at this metric from the peer point of view, we find that countries rated BBB has been more consistent than India in terms of maintaining their momentum. Resultantly, the BBB baskets average growth between CY16 and CY19 hasn’t changed much and has been steady at 4.4%.
Notwithstanding however, we note that by the virtue of averaging 7.1% average rate of growth between CY16-CY19, India remained the fastest growing sovereign among BBB rated peers. Also worth noting is the fact that despite the lower than average growth in CY2019, not much change is seen in the general variance of the metric in India’s case. Consequently, India’s standard deviation for GDP growth stands at 0.7 as compared to a peer average of 0.6.
Source: Trading Economics; Acuité Research
Assessing GDP Growth (CY16-19)
Numbers Talk: Comparing the BBB Rated Sovereigns
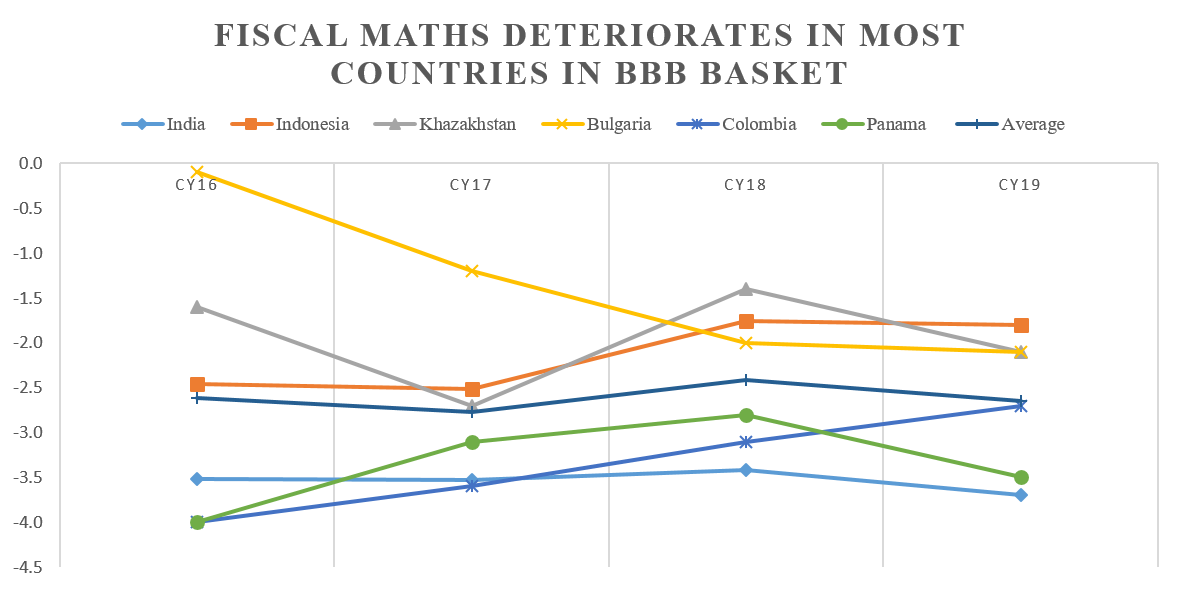
Fiscal Discipline: BBB basket records an average fiscal deficit of -2.6% between CY16-19 - below India’s -3.5%; the variance over the years is however much higher than that of India’s
How effectively a Government manages its finances is yet another consideration for rating sustainability for any sovereign and India is no exception. In this parameter, we note that India figures in the upper range of the spectrum. Bearing in mind a few obligations under the non-consolidated account, India’s -3.5% average fiscal deficit average between CY16-19 is higher than the peer average of -2.6%. The basket sees a deterioration of the metric in every sovereign, including Croatia, which until CY19 – recorded a fiscal surplus.
Notwithstanding, India has been the most consistent with its fiscal responsibility mandates (under FRBM). Despite recording one of the highest deficits in the region, India’s fiscal deficit variance is the least among peers. With the variable’s standard deviation recorded at just 0.1 as compared to peer average of 0.5, India has been surprisingly frugal in an environment where an expanding fiscal space is the only alternative to drive growth. We are also cognizant of the fact that India is the only country in the BBB basket that can be effectively classified as a domestic consumption driven economy, which cannot export its way out of recession.
Fiscal Deficit Average (CY16-19) Among BBB Rated Sovereigns

Source: Trading Economics; Acuité Research
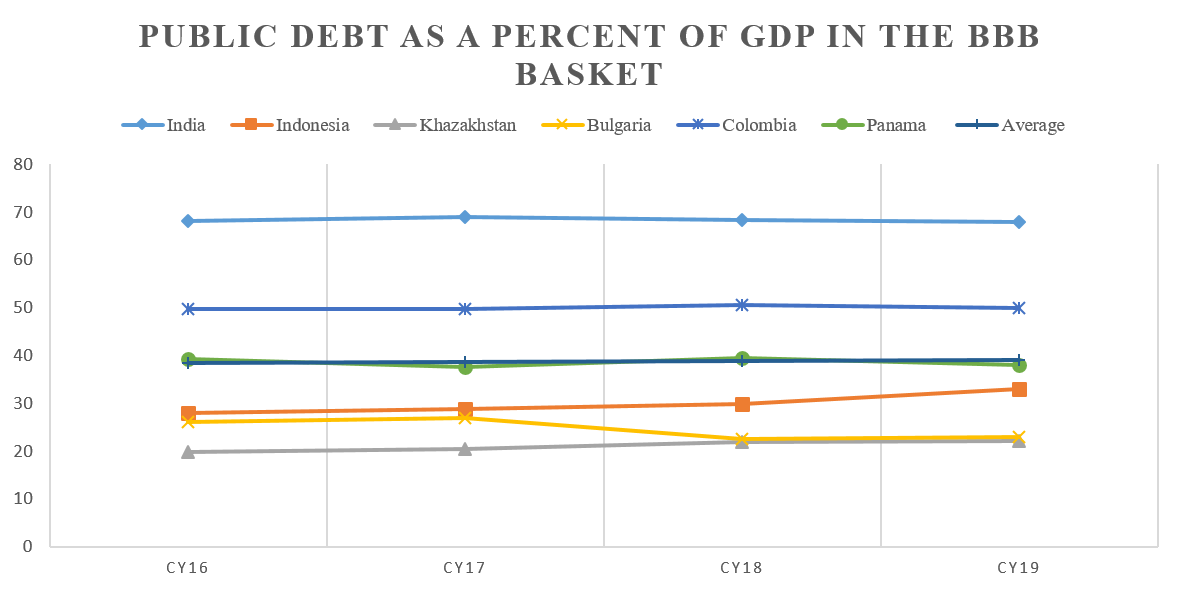
Public Debt: As a percent to GDP, India’s public debt has been assessed to be at 68%; Peer average has been a little over 39% with a variance of 1.1
Much like fiscal deficit, the evolving picture of public debt also provides a sense of fiscal discipline and a sovereign Government’s ability to finance its obligations through internal accruals. Consequently, the higher the size of sovereign debt, the bigger the inability to finance capital expenditure through internal sources. A large public debt quantum also means that a Government has been rolling over its debt obligations in the presence of newer issuances.
In this parameter as well, India records the highest public debt obligation, just over 50%, which is recorded by the Latin American crude exporter, Colombia. From the overall basket perspective, the average between CY16-19 is recorded at 39%, while India sits at 68%. However, the parameter also suggests that India has been most consistent with its expectations of future obligations and does not see any significant divergences. Public Debt variable records a standard deviation of 0.3, lowest among peers, which averages at 1.1.
One Basket Fits All: Where does India stands?
While India is part of the BBB basket, we have tried to compare its metrics with both the BBB- and BBB+ baskets, respectively. This is an attempt to identify which basket offers the most comparable macro factors and is the best fit for India. In order to achieve this objective, we have identified variables such as population, public debt, economy size and growth, inflation along with fiscal deficit.
We note that despite the lowest per-capita income, India continues to record the largest GDP size amongst all baskets. However, it is also home to a vast population, result of which its per-capita income is recorded at the lower ranges of each basket, against which it is considered. Having said that, by far the best fit for India remains the BBB basket, given various similarities amongst macro variables. This is notwithstanding the discrepancies in the per-capita income – a fact that is common in all baskets.
Considering the BBB basket, the findings suggest that India exceeds the basket averages pertaining to size of sovereign debt/ public debt and fiscal deficit significantly. Even though it still fares better in other parameters such as economic growth and sheer size of GDP, India barely manages to salvage its outlook in comparison to peers.

Source: Trading Economics; Acuité Research
Public Debt Average (CY16-19) Among BBB Rated Sovereigns
If we go one notch down, we note that while the macro variables, such as size of GDP, economic expansion and exports are fundamentally incomparable to that of India, a much larger fiscal space is available to the sovereigns. Case in point is the size of sovereign debt/ public debt, which averages at 78% in the basket as compared to India’s 68%. Fiscal deficit mean of -2.0% as compared to BBB baskets -2.5%, is however marginally lower.
Going one notch up, it is revealed that fiscal space is even higher with size of sovereign debt/ public debt averaging 82% and fiscal deficit mean going up to almost 3%. The size of the economy averaging slightly over $1 trillion is also closest to India’s $2.94 trillion. Similar story is observed in exports, where BBB+ basket averages $289 billion as compared to India’s $330 billion. The BBB as well as the BBB- basket on the other hand record the variable at $103 billion and $38 billion, respectively.
Most BBB+ basket nations enjoy supranational sovereign guarantee of the EU
However, one observation regarding the BBB+ basket is the fact that apart from Thailand and South Africa, most sovereigns such as Italy and Spain are part of the European Union (EU) Schengen area/ common trade area. Resultantly, these nations enjoy a supranational sovereign guarantee of the EU, which can be treated as more or less unconditional, given the agreements under the Lisbon Treaty.
Macro Comparison: BBB Basket
Macro Comparison: BBB- Basket
Macro Comparison: BBB+ Basket
This provides an opportunity to these nations to maintain public debt as a proportion to their GDP in excess of over 100% and a fiscal deficit of nearly 2.5%. All this when their economic growth rates are sub-2% and inflation figure barely meeting the European Central Bank’s (ECB’s) 2% target.
As a trend, it is therefore apparent that higher rated sovereigns are those which have very small population sizes which in turn translates into respectable per capita incomes despite modest GDP sizes. Despite its large economic clout, India continues to suffer in per capita terms due to its enormous population size. Unless the country breaches the threshold of $15,000 per capita (PPP), India may continue to languish in lower rated baskets, which offer lower fiscal and monetary space. Even though the condition is difficult in an environment where the country is finding itself in the middle of a hard place and a rock, India’s economic outlook depends on how well it is able to manage itself during these challenging times and effectively plans ahead.