 +91 99698 98000

DEC-21 IIP: SOBERING END TO 2021
14 Feb 2022
KEY TAKEAWAYS
|
India’s industrial production decelerated to a 10-month low of 0.4% YoY in Dec-21 from 1.3% in Nov-21 (revised lower from 1.4%). The actual print for Dec-21 was softer than market expectation of 1.3-1.8% (range of median consensus from various polls).
Despite the moderation in headline IIP growth, which was accompanied by a negative surprise, signals from overall assessment appear balanced otherwise.
- On sequential basis, IIP expanded by 7.5% MoM in Dec-21 vis-à-vis an expansion of 6.3% seen on average basis in the month of December (2012-2019). Despite strong sequential momentum, headline growth slipped on account of adverse statistical base.
- Sifting through the statistical base effect distorted by the pandemic, we note that Dec-21 IIP is 2.6% higher vis-à-vis Dec-19 levels, thereby underscoring the moderate recovery in overall industrial activity on a 2-year basis.
- Out of 25 industries covered by the IIP, 24 posted a sequential expansion in Dec-21 (vs. 4 in Nov-21), while only 1 saw a sequential contraction (vs. 21 in Nov-21). This highlights an improvement in the breadth of industrial activity.
Key granular details and observations
- On sectoral basis, mining, manufacturing, and utilities sector posted a strong sequential expansion. For mining, the MoM expansion of 7.6% stood at a 2-month high; for manufacturing, the MoM expansion of 9.9% stood at a 9-month high.
- Sequential activity within the manufacturing space was led by the following industries: (i) Computer, Electronic and Optical Products, (ii), Non-Metallic Mineral Products, (iii) Leather Products, (iv) Fabricated Metal Products, and (v) Printing and Reproduction of Recorded Media.
- As per RBI’s OBICUS survey, capacity utilization in the manufacturing sector improved to 66.1% (on 4qma basis) in Q2 FY22, its highest level in the post pandemic period. However, it remained below its pre pandemic level of 73.7% (on 4qma basis) in Q2 FY20. Despite relatively lower capacity utilization, IIP-Manufacturing index has managed to recoup its pre pandemic levels of output.
- On use-based side, there is evidence of across-the-board strong sequential momentum. The highlight is in the form of double-digit expansion seen in case of Capital Goods (10.7% MoM) and Consumer Durables (13.7% MoM). Nevertheless, adverse statistical base effect resulted in negative annualized growth figures in both cases.
Outlook
Going by the sequential recovery seen in most lead indicators in the month of Dec-21, it was expected that IIP growth too may show a modest improvement. This was also corroborated in our proprietary AMEP (Acuité Macroeconomic Performance) index, which exhibited a similar outturn, expanding by 3.0% MoM in Dec-21 from a contraction of 11.3% MoM seen in Nov-21. (The index for the month of Dec-21 stood at 114.6 from 111.2 in Nov-21). Given the drag from adverse statistical base effect, the actual annualized print turned out to be softer.
Going forward, subdued industrial activity is likely to spill over to Jan-22 on account of adverse impact from the spread of Omicron variant that prompted many states to reimpose restrictions on mobility and contact-intensive services. While industrial and export related activities saw minimal restrictions, disruption from the leptokurtic wave of Covid infection cannot be ruled out.
The silver lining to the near-term outlook comes from lower relative severity of the Omicron wave with most states now having comfortably gone past their peak level of infection. For country as a whole, incremental cases are down 73% (on 7dma basis) from peak with test positivity ratio declining to 5.6% from its peak of 17.6% (on 7dma basis). In addition, vaccination coverage continues to power ahead with 53% of the total population being double vaccinated currently compared to 43% at the end of 2021.
The policy environment also remains conducive for overall economic growth:
- As per the revised budget estimates for FY22, the central government is expected to ramp up capital spending in Q4. Going into FY23, the Union Budget is expected to prioritize investment led growth, which in turn will have a multiplier impact on the manufacturing sector.
- The RBI has been emphasizing on securing a durable and inclusive economic recovery and as such continued to maintain an accommodative stance in its recent Feb-22 policy outcome
On the downside, continued stress on global supply chains for select commodities on account of China’s Zero Covid policy, elevated input prices amidst significant spike in commodity prices, scaling back of fiscal and monetary policy support in most economies, and likelihood of financial market volatility (amidst rising interest rates and prospects of quantitative tightening) could weigh on overall growth momentum.
Annexure-1
Chart 1: Broad based sequential expansion seen in IIP sectors in Dec-21
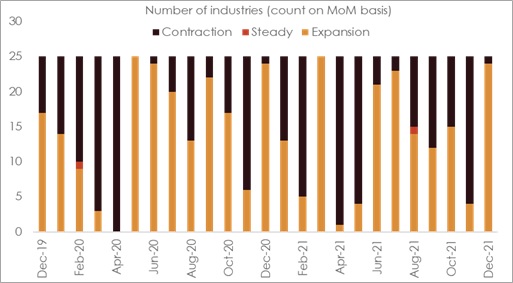
Chart 2: Despite improvement, capacity utilization remains below pre-Covid levls
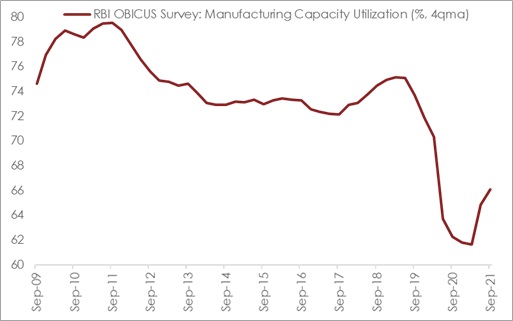
Table 1: IIP growth at a glance
